Lifetime Planning: Your Financial Future
Go to Lifetime Planning to see your projections.
What This Shows
Lifetime Planning projects your budget forward 1-60 years. It shows where your current financial trajectory leads, what events you’re planning for, and when major milestones might occur.
This is not a prediction. It’s a projection based on assumptions you control.
The Basic Function
Your monthly budget x 12 becomes annual baseline spending. Add periodic items (insurance, bonuses, vacations). Add debt payoff schedules. Add investment growth. Add life events you’re planning for (bar mitzvah, car replacement, retirement).
The timeline shows you what this adds up to, year by year.
How to Use It
1. Configure Your Assumptions
Navigate to Settings > Projections.
Set the assumptions that drive calculations:
Timeline:
- Start year (default: current year)
- Years to project (1-60 years)
Growth Rates:
- Income growth (annual % increase)
- Inflation rate (for expense adjustments)
Investment Returns:
- Savings interest rate (for cash reserves)
- Investment return rate (for market investments)
Debt Strategy:
- Avalanche (highest rate first)
- Snowball (smallest balance first)
- No payoff plan
This is the same setting as the strategy on Debt Payoff - change it in either place and both follow.
These aren’t predictions. They’re parameters. Change them to see how different assumptions affect outcomes.
2. View Your Projection
Navigate to Lifetime Planning.
What you see:
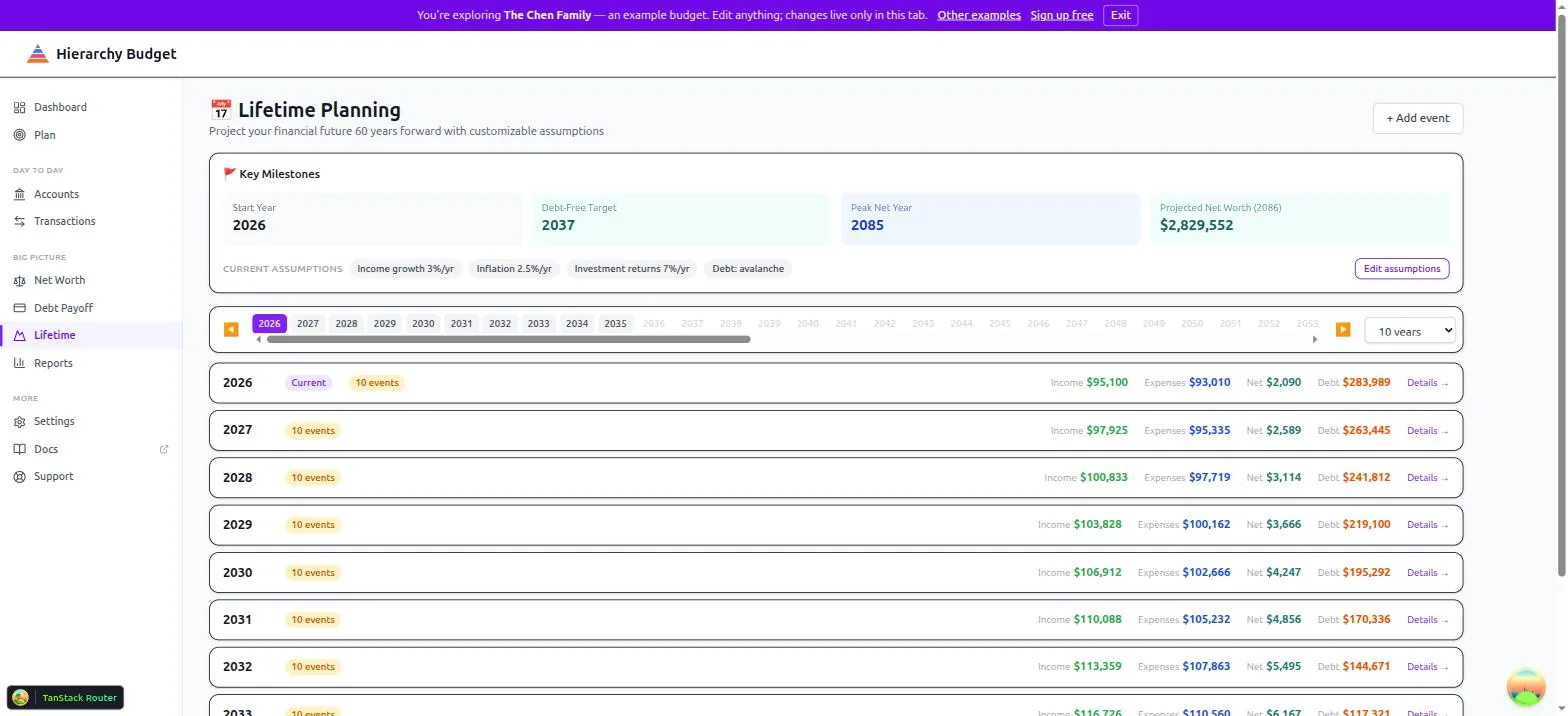
Key Milestones: Start year, debt-free target, peak net worth year, and projected net worth at the end of the range. Your current assumptions are listed beneath them, with a shortcut to edit them.
Timeline: A strip of year buttons, and a selector for how many years to show at once - 5, 10, 15 or 20. Arrows page through the range.
Year Rows: Each year shows total income, total expenses, net, and remaining debt, plus a count of events scheduled that year. Details opens that year.
3. Add Events
Click + Add event, or open a year and add one there.
Events are periodic items - the same things that live on Plan > Periodic, just viewed across decades instead of months. Each has a name, an amount, whether it’s income or expense, a category, and a frequency:
| Frequency | Meaning |
|---|---|
| One time | A single year and month - a wedding, a roof, a bar mitzvah |
| Annual | Every year, in the month you choose |
| Every 6 months | Twice a year |
| Quarterly | Four times a year |
For something that recurs every month, add it to Plan > Monthly instead - the projection picks it up from there as part of your baseline.
Amounts grow over time using the inflation and income-growth rates in Settings > Projections; there is no per-event growth rate.
4. Edit the Grid Directly
Any year’s numbers can be adjusted in place. An edited cell becomes a one-off adjustment for that year, leaving the recurring baseline untouched - so you can say “this one year is different” without rewriting the plan.
What the Projection Reveals
The Baseline Trajectory
Your current monthly budget, extended forward with growth assumptions, shows what happens if nothing changes.
If net income is positive each year, you’re building wealth. If negative, you’re consuming reserves or accumulating debt.
The numbers show the trajectory.
Debt Payoff Timeline
The debt line follows the plan you saved on Debt Payoff - the same strategy and the same monthly payment.
Set it up at Debt Payoff, which is also where you’ll find the month-by-month schedule. This page works in whole years, so treat the debt-free year here as the coarser view of the same plan.
Investment Growth
Assets grow based on your configured return rates. Savings accounts compound at savings interest rate. Investments compound at investment return rate.
The projection assumes consistent returns. Reality won’t be consistent. But the projection shows what happens if your assumptions hold.
Life Event Impact
When you add a one-time expense (bar mitzvah, wedding, major purchase), the projection shows the impact on that year’s net cash flow and debt balance.
When you add recurring events (annual bonuses, periodic car replacements), the projection shows the cumulative effect over decades.
You can see what major events cost in context of your full financial picture.
The Gap
The difference between where the projection shows you ending up and where you want to be is the gap.
That gap shows what needs to change: income, expenses, timeline, or expectations.
Common Patterns
Pattern: Debt-Free in 8 Years
Projection shows all debt paid off by 2033. After that point, previous debt payments become available for other allocations.
What this reveals:
- Current strategy and income can eliminate debt in defined timeframe
- Opportunity to redirect cash flow after debt freedom
- What financial flexibility looks like post-debt
Pattern: Net Worth Peak at 55
Projection shows net worth growing until age 55, then declining in retirement.
What this reveals:
- Retirement spending exceeds retirement income
- Drawdown rate and timeline
- How long accumulated assets last
Pattern: Negative Cash Flow Years 10-15
Specific years show expenses exceeding income.
What this reveals:
- Planned events (college tuition, weddings) create temporary deficits
- Whether reserves cover the gap or debt accumulates
- Timeline pressure points that need planning
The Assumptions Matter
The projection is only as good as its assumptions.
If you assume:
- 7% investment returns, but markets return 3%
- 3% income growth, but income stagnates
- No major life disruptions, but disruptions happen
The projection will be wrong.
This tool doesn’t predict the future. It shows what happens if your assumptions hold.
The value is in testing different scenarios:
- What if income grows slower?
- What if we don’t get the annual bonus?
- What if investment returns are half what we assumed?
- What if we need a new roof in year 5?
Change the assumptions. See what changes in the projection. That range shows your uncertainty.
Related Pages
- Lifetime Planning - View your projections
- Settings > Projections - Configure assumptions
- Debt Payoff - Plan debt payoff strategy
- Net Worth - Track assets and liabilities
- Plan > Monthly - Your baseline monthly numbers
- Plan > Periodic - Annual and periodic items